How to draw a timing chart — The shared interface between people and code, and between people
Last updated: 2026-09-25 / Category: Control design, PLC
A timing chart hands the sequence in the mechanical engineer's head to the software engineer. This guide is for the person who has to write a program from nothing but drawings and a wiring list, and for the mechanical engineer who wants to pass the sequence on.
1. Drawings carry no sequence. This diagram does
Looking at the machine does not tell you how it was meant to move. The drawings show where the cylinders and sensors are, but not the sequence "close the chuck after the advance end is reached".
A software engineer who does not know the sequence can only guess. A right guess runs; a wrong one stops the line during commissioning. The timing chart takes that sequence out of the drawings and places it between the hardware and the software. Waveforms and arrows are only the surface; the substance is the three things below.
2. The three things the chart holds
① Cut continuous motion into states
The first is to cut motion that has no breaks into "states". A rod moves continuously and a motor keeps turning. Software cannot handle anything without boundaries, so a cut is made somewhere: "advancing until the advance-end switch turns ON", "advanced once it is ON".
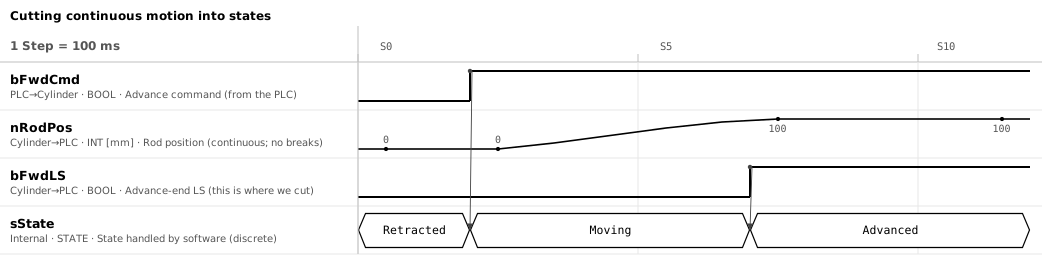
Why it matters — Only the mechanical engineer knows where to cut. The position of a sensor and the position the mechanical engineer calls "complete" are not always the same. Without the cut on the chart, the software engineer treats the sensor's ON as complete.
② Synchronize devices with different cycles
The second is the procedure that keeps devices with unrelated cycles in step. The PLC scans every 10 ms, the robot has its own cycle, the neighbouring machine runs on another PLC. None of them knows the other's cycle. Just throwing a signal means it may vanish before the other side looks, or be picked up twice when you meant once.

Why it matters — Each device can be built correctly on its own and still break where they meet. The four changes request ON → response ON → request OFF → response OFF (the handshake) are not a trick. They are the smallest procedure by which two asynchronous devices reliably agree on a state. Skip a step and the two implementations diverge exactly there.
③ Fix the boundary of responsibility between devices as a contract
The third is the promise between devices. It is decided down to the timing: "leave at least 500 ms between Servo Ready turning ON and the run request". The waiting time is drawn as the waveform of the timer we run, and what the other side raises and when we raise ours are separated into rows. Which row belongs to whom is what makes the boundary visible.

Why it matters — Once this is agreed, each side is free to build its own internals. Whatever the amplifier does inside, the PLC side does not change as long as Ready and the 500 ms are honoured. Without the agreement, both sides build on guesses about the other, and commissioning turns into "your side is slow" and "your side dropped it first".
3. How it appears on the chart
- Edges of the waveforms — The state boundaries of ①. Where ON and OFF switch is where the state changes
- Arrows — The condition for crossing a boundary of ①. Drawn from edge to edge. In the software, one arrow is one condition. An edge with no arrow is a condition not yet decided
- The four changes of request and response — The synchronization of ②. Draw all four for any signal that crosses devices; never a one-step pulse
- Row order — The boundary of ③. Group rows by the device that drives them, cause above and effect below. Where arrows cross between devices is the agenda for the meeting
- Time as numbers — The timing conditions of ③, written as "at least 500 ms" or "reply within 3 s". The time axis (Step) only carries order, so time is passed as a number, and the measuring is shown as a timer waveform
- One storyline per sheet — There is one time axis. A normal cycle, a fault stop and homing are separate charts; branching belongs in the How to draw a PLC control flowchart
4. Drawing order
- List the devices and the signals exchanged at the boundary Group the rows by device and add the variable name and device to each signal, e.g. Load request bLoadReq / Y020.
- Draw one normal cycle, cutting at each state boundary From start to completion, place the edges in order and join them with arrows. An edge you cannot join is a cut not yet decided.
- Add the timing conditions at the boundaries as numbers Waiting times and response deadlines, next to the edge or in the row's comment.
- Draw faults and recovery on separate charts Same rows, different storyline. Decide where it stops, which signals drop, and how it returns to the home position.
5. Where people trip
- Drawing signals on different devices as changing "at the same time" — Separate devices run on their own cycles and never change simultaneously. If the order matters, join them with an arrow; if it does not, make that visible
- Passing a one-step pulse to another device — A receiver with a longer cycle misses it. Signals that cross devices should drop only after the response is seen (the four changes)
- Using the sensor's ON as the state boundary — The sensor's position and the position the mechanical engineer calls "complete" are not always the same. Decide the cut by state, not by sensor
6. After the chart is drawn
The arrows become the decisions of the flowchart (the conditions to move on), and the rows become the variables of the address map.
The tools used for the figures in this article
Every figure in this article was drawn in the Timing Chart Editor and exported as SVG.
- Timing Chart Editor — Arrange rows by the side that drives them (M / S), draw arrows from change to change, and write waiting times and comments.
- Flowchart Editor — Turns the arrows of the chart into decisions and waits and assembles the flowchart.
- Address Map Editor — Allocates PLC devices to the signals of the chart.
No installation, no sign-up. They run in the browser.
Related articles
- Making a timing chart in Excel
- Making a timing chart in draw.io
- Handshake timing chart (sample)
- Air cylinder timing chart (sample)
- Belt conveyor timing chart (sample)
- Servo positioning timing chart (sample)
- How to draw a PLC control flowchart
- How to build a PLC address map
- How to draw a system diagram
- Let AI draw the specification
- JSON data format — The format the four editors read and write, with schema, validation and examples
- How to write a control specification
- How to draw a cycle time chart
yk.builds