Let AI draw the specification — Turn an Excel list into diagrams and have AI check the result
Last updated: 2026-09-23 / Category: Control design, PLC
Have AI convert an Excel I/O list into JSON and the diagrams are made without copying anything by hand. This guide is for the designer who has the list but not yet the diagrams, and for anyone who wants AI to check a finished diagram.
1. Do not let AI draw pictures; let it write data
What you ask AI for is not a picture but the JSON the editor reads. Ask a generative AI for a diagram as an image and the lines drift, the text smears and the number of signals changes on its own. Ask for a fix and something else breaks.
The JSON data format read and written by the four editors is public. Knowing the format, AI only has to write data, not draw. Drawing is the editor's job: lines do not drift, and a fix does not break anything else.
For the same reason, checking is done on data, not on an image. Which signal triggers which, and which decision has which exits, is in the data. Read from an image, AI mistakes which transition an arrow starts from.
2. Import the Excel I/O list as JSON instead of copying it
A list you already have becomes a diagram without copying.
The steps: show AI the format, paste the table, import the JSON
- Have AI read the JSON data format page (paste the page text for an AI that cannot open URLs).
- Paste the Excel table as it is (copy and paste gives tab-separated text).
- Ask: "turn this into JSON of this format with
kind: "timingchart"". - Copy the returned JSON and paste it into the editor's File → Import… → Paste JSON.
How to ask: rows and directions only, no waveforms
Following the specification at https://fa-spec.com/json-format,
create JSON with kind: "timingchart" from the I/O list below.

- steps is 16
- BOOL values are true/false, numbers are strings, unset is null
- role is "M" for signals the PLC outputs and "S" for signals the servo outputs
- The waveforms are not decided yet, so set them all to false

Variable	Type	Comment	Direction
bStartReq	BOOL	Positioning start request	M
bBusy	BOOL	Busy	S
bInPos	BOOL	In position	S
nTargetPos	DINT	Target position	M
Have every waveform set to false and only the rows and directions prepared. When each signal changes is the design decision itself, not something for AI to decide.
The same for the address map: leave the numbers empty and allocate in the editor
A device comment list or the I/O list from mechanical design can be imported with kind: "addressmap". Have address left empty.
Number allocation is not left to AI. It is counting while watching device ranges, types and bit packing all at once, and AI gets it wrong. Import with the numbers empty and allocate in bulk with the editor's "Assign addresses…" (Ctrl+R). Duplicates and out-of-range numbers are detected automatically.
Coordinates (x / y) need not be written either. The system diagram and flowchart editors lay out data that has no coordinates automatically.
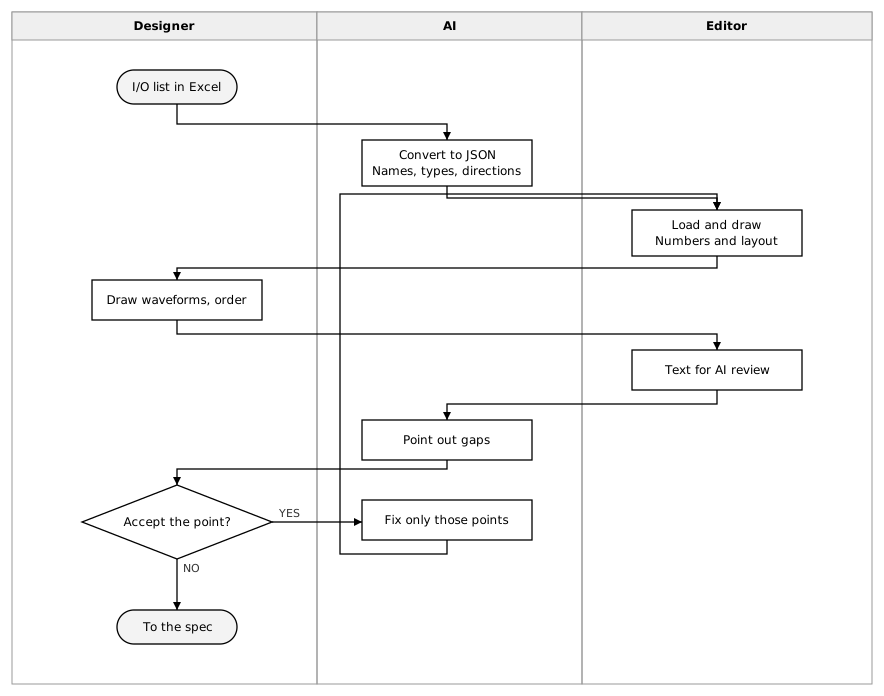
Who does what: the editor counts, the designer decides when things change
Counting goes to the editor; deciding stays with the designer.
| Who | Task |
|---|---|
| AI | Sorting names, types, comments and directions; transcribing from a prose specification; pointing out omissions |
| Editor | Consecutive numbers, bit positions, remaining device space, matching step counts and waveform lengths, layout and line routing |
| Designer | When what changes (waveforms, order, waiting times); whether to accept a finding |
3. Before review, have AI look at the finished diagram through the review text
Run it past AI once before the review. Every editor has "Text for AI review…" under Output → Export… (Ctrl+E). It produces the diagram's contents with a note on what to look for; paste it into the AI as it is.
Timing chart: ordering contradictions and changes without a trigger
- Request and response out of order — the request drops before the response is checked
- A missing interlock — a start request passes even during a fault
- A missed signal — a one-step signal the other side cannot catch
- A change without a trigger — a change nobody can explain the cause of
The last item cannot be found in a chart without How to draw a timing chart. The review text includes the list of arrows; add "list the changes with no arrow" and it names the unjustified changes. Those are usually the places where the specification is not yet decided.
Flowchart: loops with no exit and branches with no destination
- A loop with no exit — no condition anywhere leaves it
- Unreachable processing — no combination of branches ever gets there
- A branch with no destination — one of YES / NO leads nowhere
Address map: inconsistent names, and types that do not match their storage
- Inconsistent names —
bStartandStartBitmixed together - Type and storage mismatch — a DINT in one word
- Room for expansion — whether the spare for future units is contiguous
Duplicates and out-of-range numbers are found by the editor itself and attached to the review text. Inconsistent names, type and storage, and expansion space are for AI.
4. For fixes, copy the JSON and ask for "only the points raised"
If you agree with a finding, have AI make the fix too, round-tripping the JSON. Output → Export…, choose JSON, then Copy to clipboard. Ask: "keep this structure and fix only the points raised". Paste the returned JSON into File → Import… → Paste JSON; no file is created.
Name the places to fix. Ask for a "redo" and unrelated parts change as well.
Loading JSON cannot be undone with Ctrl+Z. Save the current work with "Save as…" before loading.
5. Where it fits: retrofits, reading a customer specification, before review, handover
It pays off when a list or a prose specification already exists and the diagrams do not.
| Situation | What to do |
|---|---|
| Retrofit of an existing machine | Turn the previous device comments into JSON and draw only what changes |
| Reading a customer specification | Have the prose specification turned into JSON, draw it, and ask the customer "is this right?" |
| Before review | Run the review text first and fix what would be raised |
| Handover | Hand over the diagram and the JSON together; the receiver can have AI read it too |
6. Check company rules before pasting; the designer decides whether to accept a finding
- Check your company's rules before pasting customer information into an AI. Device models, IP addresses and product names tend to be left in. The editor keeps data on your machine; the moment it is pasted into an AI, it leaves.
- Whether to accept a finding is the designer's call. "An interlock is missing" may already be covered by the safety circuit above.
- If the JSON will not load, first check what was pasted. The AI's explanation, or the
```around the JSON, stops it loading. Paste from the first{to the last}. If it still fails, check that the diagram's array is there:rowsfor a timing chart,nodesfor a flowchart,devicesfor a system diagram,variablesfor an address map.
What you use
The division-of-work figure above was drawn with the lanes (columns per role) of the Flowchart Editor and exported as SVG.
- JSON data format — the specification to show the AI
- Timing Chart Editor — signal order and triggers
- Address Map Editor — variables and number allocation
- Flowchart Editor — states and transition conditions
- System Diagram Editor — devices and their connections
No installation, no sign-up. Your data is stored only on your machine and never sent to a server.
Related articles
- How to draw a timing chart
- How to draw a PLC control flowchart
- How to build a PLC address map
- How to draw a system diagram
yk.builds