How to draw a system diagram — Remove guesswork between roles and lay the base for the next steps
Last updated: 2026-09-25 / Category: FA system design, control hardware
A system diagram lets the panel builder, the software engineer and the installer start ordering and configuring from the same assumptions. This guide is for anyone who splits communication settings and equipment ordering with other people.
1. Without a diagram, each role starts working on its own assumptions
When a PLC and a robot fail to communicate, two causes come up again and again. Either the same IP address was set on both devices, or both were configured to be the communication master. In both cases a setting that must match at both ends was decided separately by separate people.

The panel builder guesses from the last panel, the software engineer from the last project, the installer from the drawings at hand. You usually find out a guess was wrong when the network does not come up on site. The system diagram is the one sheet that removes those guesses before ordering and wiring. There are three reasons to draw it.
2. Three reasons to draw the diagram
① Decide the settings both ends must share, in one place
The first reason is to decide, on the diagram, every setting that must match at both ends of a cable. IP addresses and station numbers, master and slave, port direction. None of them works when only one side is right.

Why it matters — The two ends are configured by different people with different software. The software engineer sets up the PLC, the robot engineer the robot, the panel builder the switch. Unless both values sit on one sheet, the mismatch is not found until you are on site.
② Show the boundaries of responsibility and the physical limits
The second reason is to put on the diagram who orders what and who is responsible for it. Where the factory LAN ends and the control LAN begins. Whether the switch has enough ports. Whether the number of daisy-chained devices and the wiring direction stay within the rules of the protocol.
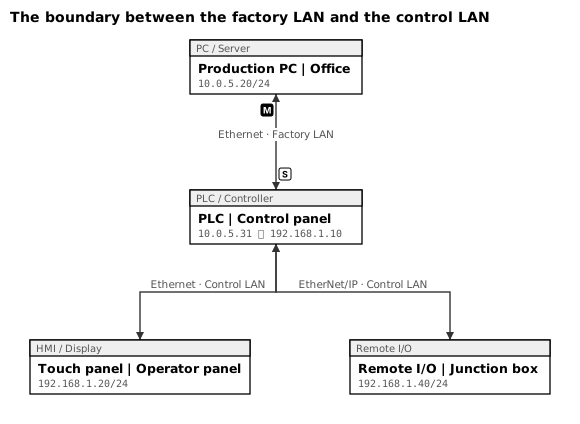
Why it matters — When boundaries and counts are spread across each role's own drawings and tables, nobody counts them. The customer's IT staff care about the LAN rules, the panel builder about port counts, the software engineer about device limits. On one sheet you can spot a missing order, or control traffic flooding the factory LAN, before it happens.
③ Fix the base for software design first
The third reason is to fix the skeleton of the system before software design starts. The devices and their groups in the diagram become the partitions of the address map. The signals exchanged between devices become the rows of the timing chart.
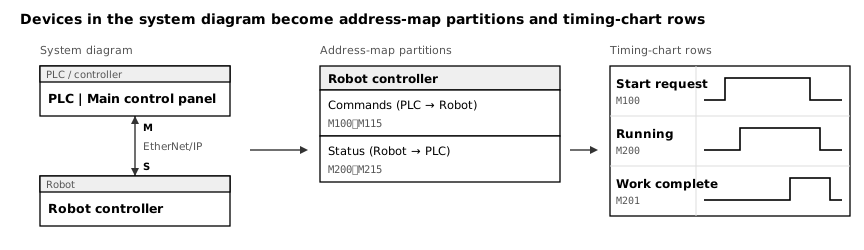
Why it matters — Until the skeleton is fixed, neither the variable allocation nor the sequence can be decided. Add one device and you add a partition and more signal rows. Change the configuration later and you will be fixing both the address map and the timing chart.
3. What to write on the diagram
- On each line: the protocol and the cable — The protocol decides the ports, the switch and the software used for configuration. The cable type (STP, M12, fibre and so on) is what the installer orders
- On each device: the location and the address — The location decides who pulls the cable and how long it is. Write IP addresses and station numbers next to the device they connect to, not in a separate table
- Master / slave per line, not per device — One device can be a slave on one line and a master on another (see below)
- Topology as actually wired — Star through a switch, or daisy chain. Some protocols, such as EtherCAT, distinguish the IN port from the OUT port
- The boundary with the factory network — Which device connects to the upstream LAN, and where the cut is. This is agreed with the customer, so without the boundary on the diagram the discussion cannot start
- The safety circuit — Whether emergency stop and guard door signals run on dedicated wiring or over a safety protocol (CIP Safety, FSoE and so on). This is the first thing a safety review looks at

4. Draw in this order: location → wiring → addresses → boundary → count
- Group the devices by location Control panel, junction box, on the machine, upstream (factory LAN), and so on.
- Connect them as they are actually wired Draw the star through a switch or the daisy chain as it is.
- Write the protocol and the master on each line, the address on each device Write the subnet together with the IP address.
- Write the boundary with the factory network and the safety circuit Send anything to be agreed with the customer for confirmation at this stage.
- Count and check Count switch ports, daisy-chained devices and duplicate addresses on the diagram. Include a port for the maintenance laptop.
5. Where people trip: port direction, shared switches, subnets, device counts
- EtherCAT IN and OUT ports swapped — Either the network does not come up, or the device order does not match the configuration. Draw the port direction on the diagram
- Control LAN and factory LAN on the same switch — Control traffic floods every device, because a switch without IGMP snooping does not stop EtherNet/IP multicast. Separate the control side from the upstream side, or use a switch that supports it
- Not noticing a subnet mismatch — Devices on the same cable cannot talk if their subnets differ. Write the subnet with the address and you will see it on the diagram
- Too many devices on one line — Each protocol has limits on the number of daisy-chained devices and on the cycle time. Count the devices and the cycle from the diagram and check them against the specification
The tools used for the figures in this article
Except for the bad example and the hand-over figure, the diagrams were drawn in the System Diagram Editor and exported as SVG.
- System Diagram Editor — Place devices, connect them with lines, and write the protocol and master on each line and the model, IP address and station number on each device. The devices and blocks you draw become the containers of the address map.
- Address Map Editor — Allocate PLC devices and variables to the devices in the system diagram.
- Timing Chart Editor — Draw the order of the signals exchanged between devices.
No installation, no sign-up. They run in the browser.
Related articles
- How to build a PLC address map
- How to draw a timing chart
- How to draw a PLC control flowchart
- Let AI draw the specification
- JSON data format — The format the four editors read and write, with schema, validation and examples
- How to write a control specification
yk.builds