How to draw a PLC control flowchart — Decide the states and transition conditions before writing ladder
Last updated: 2026-09-23 / Category: PLC programming, control logic design
A control flowchart decides the states of the machine and the conditions for moving between them before any ladder is written. This guide is for anyone who has built a sequence out of latches and interlocks, and then been unsure where to restart after a stop.
1. The step order can only be held as a state
Where the process currently is appears nowhere in the program unless the designer holds it as a state. A PLC re-evaluates every rung from top to bottom on every scan. No rung ever "waits for the next input".
Build without deciding the states and the progress of the process ends up encoded in a web of latches and interlocks. The current position is scattered across many coils, and the following happens.
- You trace a coil and still cannot tell why it is ON
- After removing a work piece mid-cycle, nobody knows where it is safe to restart
- Adding one condition stops an unrelated step
Split the process into steps (states) and keep exactly one step active at any time. Then the outputs to drive and the condition to leave are complete within that step. A process box in the flowchart is one step; a decision diamond is the condition for leaving it. Drawing the flowchart is designing the steps.
2. Separate processes from decisions, and put a time limit on every wait
- Separate processes (boxes) from decisions (diamonds) A box is a step: the outputs held for as long as it lasts. A diamond is the condition for leaving that step. Write "advance and wait for the advance end" in one box and nobody can tell where the step changes.
- Give every wait for motion a time limit and a destination If the input never comes because a sensor failed or a work piece jammed, the wait lasts forever. Treating the timeout as a fault is the only way a PLC can know something has stopped. Waits for a person, such as the start button or reset, may wait without a limit.
- Draw where faults go and the way back Draw the path fault stop → return to home position → waiting for start. If the step you can restart from is not decided, the restart is done by trial and error on site.
- Number the steps with gaps (10, 20, 30…) So that adding a step later does not renumber everything. Step numbers are also referenced by the touch panel display and the fault history.
- Things started together wait for both to complete The decision to move on checks both completions. Move on after only one and the next motion starts before the other has finished, and they collide.
- Never advance more than one step in a single scan Decide for each decision whether it looks at the rising edge or at the ON state. If the next condition is already true in the scan the step changed, the steps race through. A start button held down does this all the time.
3. Example — separate the boxes and the stopping points and the way back appear
A process and a wait in one box hides where the step moves on
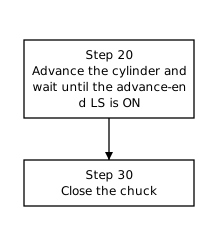
The chart does not say where in step 20 it moves on, or where it goes when the advance end never comes. Each implementer decides for themselves.
Separate processes and decisions and it maps straight onto a step-number circuit
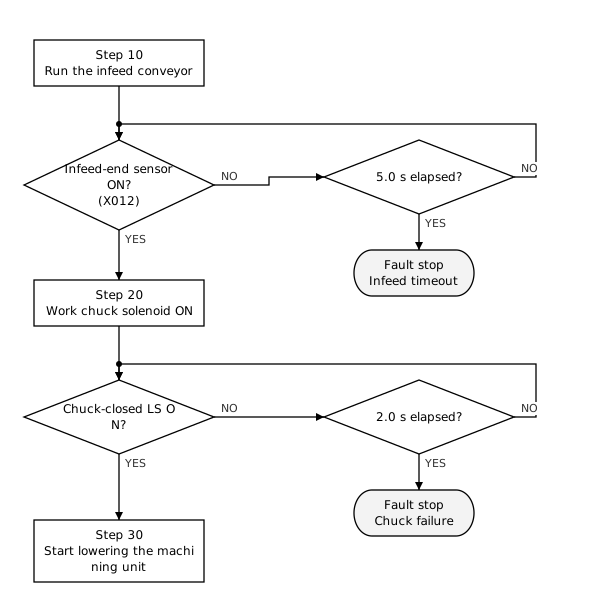
This shape translates directly into ladder with a single step-number register. When "current step number" and "decision condition" are both true, load the next number. The step number doubles as the machine status display, so you can see where it stopped.
Make the way back from a fault a loop that returns to waiting for start
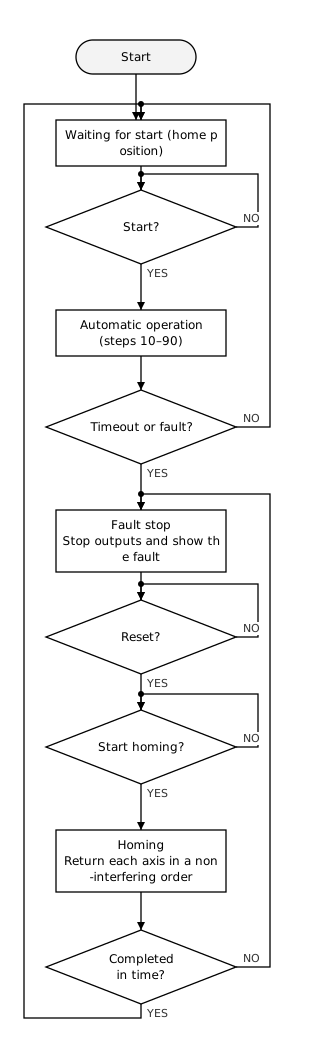
Whether the cycle runs to the end or stops on a timeout or a fault, it always returns to waiting for start. The machine is always somewhere on this loop, so there is never any doubt where to restart.
Homing starts only when the operator presses the button. If the axes moved as soon as the reset cleared the fault, they would move before the operator has checked the surroundings. To go inside and check, open the guard door and let the safety circuit cut the power first. The sequence after an emergency stop is in the Emergency stop recovery flowchart (sample).
4. Draw in this order: states → conditions → limits → way back → numbers
- List the states the machine can be in Waiting for start, infeed, machining, discharge, fault stop and so on. No need to connect them yet.
- For each state, decide the outputs and the condition to move on If there is a timing chart, its cause arrows are the conditions.
- Give every wait for motion a time limit and a fault destination Set the limit to the normal motion time plus a margin.
- Draw the way back from a fault Decide the homing procedure and the step you can restart from.
- Number the steps Leave gaps.
5. Where people trip: manual mode, homing order, decision names
- Drawing only the automatic sequence — Manual operation and homing are separate flows. What manual mode allows (inching with the door open, for example) is decided and drawn separately from the automatic flow
- Writing homing as "return each axis to home" — Depending on where the axes are, they collide on the way back. Put into the flow the order that avoids collisions from any starting position
- Giving a decision a name that hides its contents — Write only "ready" and the implementer decides what makes it ready. Write the signals the decision looks at
6. Combined with the timing chart, the ladder is almost written
Once the timing chart fixes the order and the triggers, and the flowchart fixes the branches and the fault destinations, what goes into the ladder is almost decided. The timing chart shows one storyline in time order; the flowchart shows every storyline as state transitions.
The tools used for the figures in this article
Every figure in this article was drawn in the Flowchart Editor and exported as SVG.
- Flowchart Editor — Line up processes and decisions, connect them, and number the steps automatically. It can also build the decisions and waits from the arrows of a timing chart.
- Timing Chart Editor — Decides the signal order and triggers the flow is built from.
- Address Map Editor — Allocates PLC devices to the signals used in the flow.
No installation, no sign-up. They run in the browser.
Related articles
- Homing flowchart (sample)
- Emergency stop recovery flowchart (sample)
- How to draw a timing chart
- How to build a PLC address map
- How to draw a system diagram
- Let AI draw the specification
- JSON data format — The format the four editors read and write, with schema, validation and examples
- How to write a control specification
- How to draw a PLC state transition diagram
yk.builds