Making a timing chart in draw.io — Drawing with points and lines, and where adding a step breaks it
Last updated: 2026-09-24 / Category: Timing charts, comparing methods
A draw.io timing chart survives added steps better when drawn in the editor and pasted in than when drawn with points and lines. This guide is for anyone who draws the system diagram in draw.io and wants the chart in the same file.
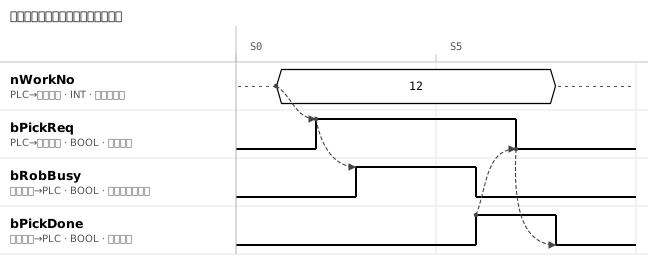
1. If you draw with points and lines, set the grid to the step width before placing points
A timing chart in draw.io is a combination of points, lines and rectangles, because draw.io (diagrams.net) has neither a template nor shapes for laying out signals. The official UML timing diagram instructions also build it from small points, lines and rectangles.
- Set the grid to the step width The grid defaults to 10, so make one step four grid units (40). Shapes and line waypoints snap to the grid, so transitions on different rows line up. Do not hold Alt while moving a transition, or it leaves the grid.
- Draw BOOL signals as points joined by lines Place a small point (a waypoint shape) at each transition and join them with straight lines without arrowheads. A single line with added waypoints looks the same, but its waypoints to the right do not follow when a step is added (section 2), so place a point every time.
- Butt hexagons together for numbers and states A number such as the work number is a hexagon labelled "12". Where the value changes, butt it against the next hexagon; the pointed ends meet and the change looks like a crossover (><).
- Draw causal relations as arrows from point to point From the point where the pick request turns ON to the point where robot busy turns ON. Drag from the blue arrow that appears over a point and release on the next point; the line connects to it. An arrow connected to a point follows when the point moves.
2. Editing and exporting hurt: waypoints do not follow an added step
A draw.io drawing holds only point positions; it knows nothing about steps or the relations between signals. Every "delay pick complete by one step" means moving points and waypoints one by one.
- The waypoints of a single line do not follow an added step — Adding a step is a drag that opens up space. Drag right with Alt, Ctrl and Shift held and only the shapes below and to the right of the click move. Waveforms drawn with points move their right-hand points, but a waveform drawn as one line starts on the left and does not move.
- Signals that change on the same step are moved one at a time — The drawing has no notion of "changes on the same step". Delay pick complete ON by one step and you also move the point where robot busy turns OFF on that step, then the points for pick request OFF and pick complete OFF after it. Arrows connected to points follow, but the drawing says nothing about a point you forgot.
- Values cannot be read back from the drawing — Select a point and the Arrange tab shows only coordinates. Whether pick complete turns ON at step 6 or 7 has to be worked back from that number or counted on the grid. Shapes and lines can be generated from CSV, but waypoints cannot, and edits in the drawing never flow back to the CSV.
- SVG text breaks in other applications — draw.io writes SVG text as HTML by default, and applications that cannot render it replace the text with a crude substitute. For a specification, tick Convert labels to SVG on the Text tab, or use PNG in versions of draw.io that lack it.
3. Charts that change often: draw them in the editor and paste into draw.io
Such charts are drawn in the Timing Chart Editor and pasted into draw.io. The export is one way: a chart edited in draw.io cannot be loaded back. On the draw.io side, only add notes and frames. The editor with the chart above already open (opens in a new tab) lets you try steps 2 to 4 below as they are.
- Line up the signals If they are already allocated, send nWorkNo and bPickReq from the Address Map Editor with its "To the timing chart →". If not, paste the signal list into "Import…" in the variable list on the left.
- Paint the waveforms and draw the arrows Drag sideways to paint ON in BOOL rows; double-click to write a value in numeric rows. Press "Arrow" on the toolbar and drag from the transition where the work number appears to the transition where the pick request turns ON. Arrows are stored by step number, so inserting a step shifts the waveforms and arrows behind it together.
- Paste into draw.io Choose Draw.io in the export, copy, and paste into a new page with Ctrl+V. If the XML lands as plain text, delete it and open Extras → Edit Diagram…; select the contents with Ctrl+A, paste, and press Apply.
- Group the pasted chart and add notes Group it with Ctrl+G right after pasting, and replacing it later is just a delete. The pasted shapes sit on the grid (10), so notes and frames snapped to the grid line up with the transitions. The waveforms and arrows are not connected, so moving a transition inside draw.io leaves the arrow where it was.
4. A chart edited in draw.io: make the same edit in the JSON and export again
A waveform edited in draw.io is re-done in the editor's JSON before the chart is replaced. Hand the .drawio to the robot engineer and it may come back with the waveforms edited in draw.io; the edit is not in the JSON, so the next export wipes it. Save the JSON with Ctrl+S and keep it next to the .drawio under the same name (JSON data format).
The tool used for the figure in this article
The figure in this article was drawn in the Timing Chart Editor and exported as SVG.
- Timing Chart Editor — Line up the signals, paint the ON ranges, draw the causal arrows. Choose Draw.io as the export format to get a diagram that pastes into draw.io.
No installation, no sign-up. It runs in the browser.
Related articles
yk.builds