How to draw a PLC state transition diagram — Put the machine states on one sheet and fill the undrawn combinations in a table
Last updated: 2026-09-24 / Category: PLC programming, control logic design
A state transition diagram shows on one sheet which state the whole machine is in, and which button or fault moves it where. This guide is for the PLC control designer who does not want combinations missing from the specification to be decided by whoever writes the ladder.
Start was pressed again while the machine was running, and the flag of the first step was set a second time. The combination is not in the normal flow of the flowchart, so whoever wrote the ladder decided it on the spot. A diagram only shows the arrows you thought of. The combinations you did not draw are filled in, cell by cell, in a state × event table.
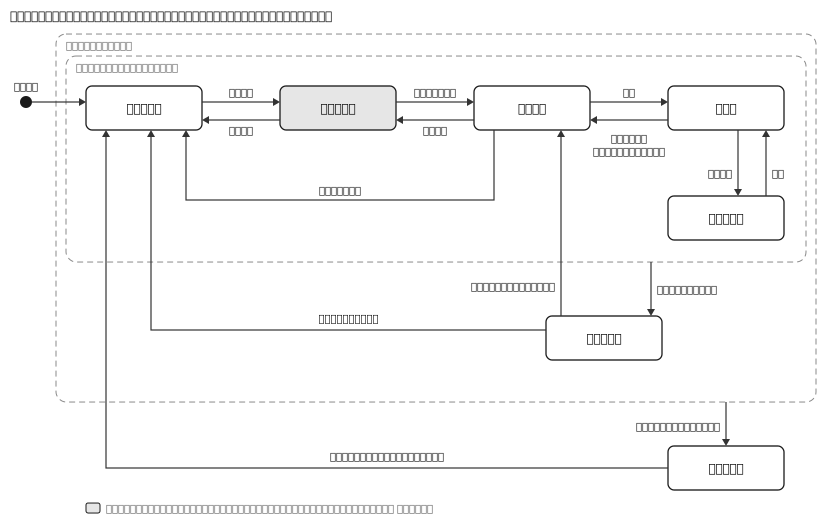
1. The state transition diagram holds only whole-machine states; steps go in the flowchart
The diagram shows the states of the whole machine. The example has 7, and does not show "waiting for a part → transfer → clamp → pick", the steps run while Running. Steps go in the How to draw a PLC control flowchart as step numbers (10, 20, 30…) with the condition to move on. Put the steps in here and every event that can happen from anywhere, such as a fault or a pause, needs one arrow per step.
The two sheets are linked by the step number. Start from Paused resumes the step that was interrupted; after homing it begins at the first step. After a reset from a fault that allows resuming, it begins at the top of the interrupted step.
What How to draw a PLC control flowchart called a "step (state)" is a step in this article. Once the states multiply as in this example, Waiting for start and Fault stop move into this diagram; the fault exit of the flowchart then only needs to say "to Fault stop". On a machine where the operator places a part and presses start every time, drop the cycle-stop flag condition and return to Waiting for start at the end of every step.
2. States are things that last; arrows are things that happen
- Name states as things that last and arrows as things that happen State names are conditions that last for a while: "running", "waiting for". Arrow names are instants: "start (pressed)", "fault (timed out)". A state called "Start" leaves it unclear whether it means the moment of pressing or the time it is moving.
- Separate states that are doing something from states that are waiting Grey Homing moves to Waiting for start by itself when its work is done. White Waiting for start waits until a person presses start. Homing ends when the procedure reaches its last stage (in the Homing flowchart (sample), the stage that sets bHomeDone).
- Draw a "from any state" arrow once, from a frame A fault can happen from any of 5 states. Instead of 5 arrows, draw one from a frame around the 5 states other than Fault stop and E-stop to Fault stop. In a diagram with every arrow drawn out, nobody notices one is missing.
- Draw where the machine starts at power-on In the example, the arrow from the power-on dot goes to Not homed. After a power failure, parts are left mid-cycle and the axis positions are uncertain. Keep the state variable in retentive memory and a machine that lost power while Running starts moving with nobody having pressed start.
- When one event has two arrows, make the conditions exclusive Reset from Fault stop has two destinations: Waiting for start when resuming is allowed (E01 and E02 in the How to write a control specification), otherwise Not homed. If both conditions can be true at once, the destination is decided silently by the order in the program.
- Keep modes on a separate axis and decide, per state, where a mode change goes The example shows the states of automatic mode. On switching to manual, Not homed and Fault stop allow manual motion as they are, while Waiting for start moves to Not homed. Nobody knows what was moved during setup, so one homing run re-checks everything before returning to automatic.
3. Fill the combinations you did not draw in a state × event table
The diagram has 14 arrows besides power-on. As a table it is 7 states × 10 events, 70 cells, and copying the arrows fills only 25. The other 45 never appear in the diagram. Start pressed while Not homed, start pressed again while Running: each is decided one cell at a time.
A cell holds one of five things, and "not accepted" is different from "cannot happen". A not-accepted cell is checked at the acceptance test by pressing the button and seeing nothing happen. A cannot-happen cell cannot be tested by pressing; if it does happen, it is a program error and the machine goes to Fault stop.
- → state name — Move to that state. If it depends on a condition, list "condition → destination"
- Text only — Stay in the state and do only what is written (set a flag, add to the history, show a message)
- / — Not accepted. Nothing happens
- × — Cannot happen
- Blank — Not decided yet. None left by shipment
| Event \ State | Not homed | Homing | Waiting for start | Running | Paused | Fault stop | E-stop |
|---|---|---|---|---|---|---|---|
| Home (button) | → Homing | / | → Homing | / | / | / | / |
| Homing complete | × | → Waiting for start | × | × | × | × | × |
| Start | Show "Not homed" | / | In the resume position → Running Not in position → show "Not in the resume position" | / | → Running (resume the interrupted step) | / | / |
| Pause | / | → Not homed (abandon homing) | / | → Paused | / | / | / |
| Cycle stop | / | / | / | Set the flag | Set the flag | / | / |
| End of a step | × | × | × | Flag set → Waiting for start No flag → keep waiting for the next part | × | × | × |
| Fault | → Fault stop | → Fault stop | → Fault stop | → Fault stop | → Fault stop | Add a newly raised fault of another number to the history (resuming is no longer allowed) | Add the new fault to the history |
| Reset | / | / | / | / | / | Cause still present → / Resuming allowed → Waiting for start Otherwise → Not homed | Before release → / Released and power restored → Not homed No power 3 s after release → show "Power not restored" |
| E-stop | → E-stop | → E-stop | → E-stop | → E-stop | → E-stop | → E-stop | / |
| Switch to manual | Manual motion allowed | → Fault stop | → Not homed | → Fault stop | → Fault stop | Manual motion allowed | Change only the mode |
"End of a step" is a condition that exists only while Running, while the first step (waiting for a part) is waiting for the next part. Start from Waiting for start is accepted only in the home position for the first step, or with the conditions at the top of the interrupted step met when resuming. The cycle-stop flag is cleared on entering Waiting for start, Fault stop or E-stop. The fault row covers E01 to E04 of the fault list; the E-stop (E05) has its own row.
The cells people hesitate over are these.
- Start while Running is / — Hold the state in one variable and accept start only in Waiting for start or Paused. In ladder that chains per-step flags with SET / RST, start gets through while the machine is moving and you get the double start from the opening. Decided in the table, the condition lives in one place: the start circuit
- Start while Not homed is refused with a message — If nothing happens, the operator presses start again and again and calls maintenance. Start while in Fault stop stays /: the fault is already displayed and the screen explains why it does not move
- Reset while the cause is still present is / — The fault signal keeps coming back as long as the cause lasts. Refusing the reset keeps the fault on the screen and tells the operator what to fix
- Pause while Homing returns to Not homed — Decide that an interrupted homing starts over, and there is nothing to remember. Resuming a homing halfway means remembering how far each axis got
Make the table in Excel, give it a version number and put it in the specification. A data-validation list of "/,×" with the error message switched off still lets you type "→ Waiting for start". Paint blank cells red with the conditional format =ISBLANK(B2). Add an event, and unless you add a row and fill all 7 cells, the diagram, the table and the ladder drift apart.
4. Collect states and events, draw the normal arrows, then fill the table
- List the states Take them from the operating conditions you want on the panel lamps and the screen. A state is something entered and left by a separate action: an operator button, a fault, the completion of homing. Transfer and clamp, which advance on sensor conditions, are steps and go in the flowchart even if the screen says "transferring".
- Collect the events From the panel buttons and switches, completions, conditions checked only while Running, and faults. The faults of the fault list share one row; only the E-stop has its own. Operations that do the same thing in every state, such as buzzer stop, stay out of the table.
- Draw the normal arrows, and frame what can happen from anywhere First from power-on to Running, and the way back after a stop. Fault and E-stop: one arrow each, from a frame.
- Make the table and fill the blanks Copy the arrows of the diagram, then fill the remaining cells with /, × or text. Leave the cells you cannot decide blank and note next to them who can (customer, mechanical design, safety).
5. In the PLC, hold the state in one variable and change it at most once per scan
- Hold the state as a number in one variable Put the state number in a single integer. With one flag per state, nothing in the design prevents two being set at once. A non-retentive variable reads 0 after power-on, so make Not homed number 0.
- Evaluate transitions on the state at the top of the scan, and change it at most once per scan Evaluate against a copy of the state taken at the top of the scan. Written top to bottom as "if Waiting for start and start then Running", a lower rung sees the freshly written Running and moves on again. Write the next state once at the end; in an ST CASE statement only one branch runs per scan.
- Write the "from anywhere" transitions after the per-state ones Order: per-state transitions → fault → E-stop. The last assignment wins, so when start and E-stop coincide in one scan, E-stop wins. Each frame arrow in the diagram is one place in the program too.
- Separate entry actions from continuous outputs Entry actions run only in the scan where the number changed. Record the fault number on entering Fault stop every scan, and the history grows by one entry per scan. Outputs that depend only on the state, such as lamps and displays, are one expression per output: "red = Fault stop or E-stop".
- An impossible number goes to Fault stop In the ELSE branch, move to Fault stop and show the number on the screen. An empty ELSE, or one that returns to Waiting for start, hides a write from another circuit or a typing mistake. The same applies when a × cell of the table happens.
- Buttons are events at the moment of pressing; E-stop and faults are checked as long as they hold Look at buttons for the one scan of the rising edge. Accept them while ON and the machine starts the instant a part is placed with start held down. E-stop and faults are the opposite: check them every scan while they hold, so that powering on with the button pressed still moves to E-stop.
6. Where people trip: cycle-stop feedback, counting the wait for parts, the role of the E-stop
- Nothing on the screen after pressing cycle stop — While the flag is set, show "Cycle stop accepted". If it just sets a flag and keeps Running until the end of the step, the operator cannot tell whether it is stopping or the press was missed
- Not deciding whether waiting for parts counts as running — Agree in writing with the customer, before the acceptance test, which states count as running. In factories that compute availability from state times, the number changes with where the wait for parts goes. The example counts it as Running; PackML separates Held (the machine's own reasons) from Suspended (upstream or downstream reasons)
- Thinking E-stop is a state where the PLC does the stopping — The safety circuit cuts the power; the PLC only receives that fact. Try to stop through the PLC state machine and nothing stops when the PLC itself stops. The PLC's job is to drop its motion outputs and latches and to enforce the recovery order (Emergency stop recovery flowchart (sample))
7. The 58 cells that are not × are the acceptance test items
The 58 cells that are not × are the test items. For a → cell, check the destination state and the entry action; for a / cell, press the button and check that nothing happens. Raise faults and E-stops from every state inside the frame, not only from Running. A timeout while Homing and an E-stop while Paused are the combinations most often left out.
After the single cells, test sequences of two operations. Press cycle stop, then pause, then start: is the flag still set, and does it stop at Waiting for start at the end of the step? Power off and on while Running: does it start in Not homed with nothing moving (or E-stop, if the safety relay needs a manual reset)? Checking the table one cell at a time does not find these ordering errors.
The editor for the step flowchart
- Flowchart Editor — Draws the steps run while Running (waiting for a part, transfer, clamp, pick) as step numbers with the condition to move on. It does not draw the state transition diagram itself.
No installation, no sign-up. It runs in the browser.
Related articles
- How to draw a PLC control flowchart
- How to write a control specification
- How to draw a timing chart
- Emergency stop recovery flowchart (sample)
- Homing flowchart (sample)
- JSON data format — The format the four editors read and write, with schema, validation and examples
yk.builds